
Back to the Future
The Wright Aeronautical Division (WAD) Recommended Leaning Procedure
Part 3
by George W. Braly
In part one of this series, we started by exploring the recommendations for leaning in the big Wright Turbo Compound 18 cylinder engines (known as the TC-18 or maybe more commonly as the Wright "3350"). What we learned was that those highly successful engines were deliberately operated on the lean side of peak for the following important reasons:
- To obtain extended engine life by operating the engine at high power with lowered cylinder head temperatures (and the improved engine life associated with the lowered cylinder head temperatures);
- To obtain remarkably extended range and economy in airline service at the optimal (minimum) Brake Specific Fuel Consumption. (If the crew failed to do so, the crew would get their feet wet somewhere between New York and Paris);
- To avoid operation of the engine at power settings on the rich side of peak EGT that might, under the wrong circumstances, possibly cause light detonation in the engines.
In part two of this series, we learned how it was possible, using common six-probe engine monitors that provide digital EGT readings, to create a simple table of data that would define the cylinder-to-cylinder imbalance in fuel/air ratios in our engines. Part II also showed examples of the data obtained after the fuel/air ratios had been balanced by adjusting the fuel injector nozzle fuel flows with the use of extremely precise equipment.
In Part three, we will revisit some of these issues, and demonstrate how an operator, who does have closely balanced fuel/air ratios, can save fuel running the aircraft in the traditional "rich of peak" manner. We will also look at some definitive data showing the effects of lean of peak operation on cylinder head temperatures.
Before beginning, let us take a close look at some common engineering parameters and compare them between the old "TC 18" and a common high-power general aviation engine.
| Engine Make/Type | Wright 3350 (TC18) | Continental TSIO-520NB |
| Cruise Horsepower | 1800 | 244 |
| Cruise Horsepower / Cubic inch | 0.54 hp/ci | 0.46 hp/ci |
| Cruise Crankshaft RPM | 2400 | 2500 |
From the concerns of a power plant engineer, the two engines are very comparable in their respective operating characteristics. Do not make the mistake of dismissing the wisdom contained in the old Wright Aeronautical Division's "recommended leaning procedure" as applying to "some other engine." From an engineering point of view, all of these engines have aluminum pistons that move up and down at approximately the same average speed, running in air cooled steel cylinder barrels with very similar metallurgy and spark ignition systems that burn gasoline. In short, the significant engineering similarities are vastly more important than any dissimilarities in the particular arrangement of the cylinders.
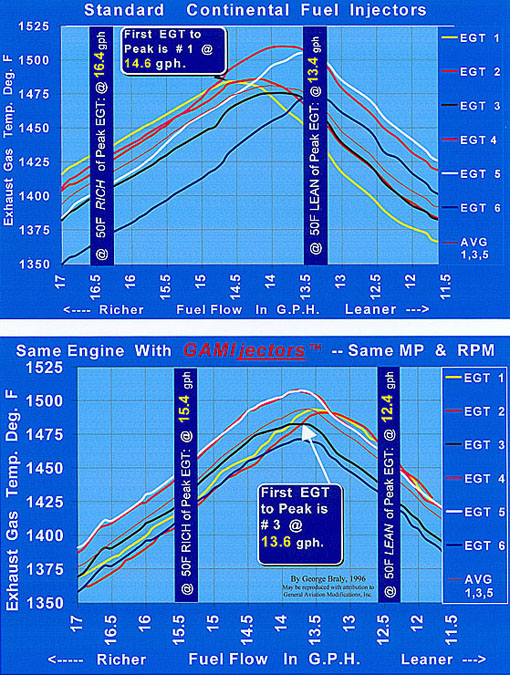
Take a close look at figure 1. This is the same basic data as was presented in figure 2 [show popup] in part 2 of this series. In the present version, the vertical blue bars represent the fuel flow at 50 F rich and lean of the first cylinder to reach peak EGT. Thus, the vertical blue bar on the left hand side of both the upper and lower graph represent the point at which many operators would expect to operate the engine using the "conventional" ( rich of peak) wisdom.
![[show popup]](/img/articles/bttf/pt2fig2.jpg)
In figure 1, the data on top and bottom is from the same engine, the same pilot, on the same day, at the same altitude, power settings, etc. The only difference is that in the top half of the Figure, the fuel/air distribution is the result of matched but otherwise "standard" TCM fuel injection nozzles. The bottom half of the Figure shows the results of balancing the fuel/air ratios among the cylinders by altering the injector flows for that purpose.
There are several very important insights to be gained from spending a bit of time studying these graphs.
First, note that in the top graph, EGT #1 (yellow curve) peaks first during the lean cycle, followed closely by cylinder #2 (red curve.) Note that #3 and # 4 peak next, and that EGT # 5 & 6 (white and dark blue curves) peak last.
A pattern appears. Cylinders # 1 & 2 (the rear most cylinders) peak first. They are the leanest cylinders. Cylinders # 3 & 4 peak next. They are the middle two cylinders in the TCM cylinder numbering scheme. Cylinders # 5 & 6 are the front cylinders and they peak last. They are the richest cylinders. Depending upon a number of factors, either #1 or #2 may peak first, but the pair should peak at nearly the same fuel flow. The same is true of #3 & #4 and #5 & #6.
This pattern is almost universal among big bore TCM engines with the runner log-branch induction systems. The pattern is consistently observed because it is a result of the inherent design of the runner log-branch induction system. In fact, the pattern is so consistently observed in properly maintained and operating engines, that a new method of diagnosing a variety of engine problems becomes readily apparent.
Operators of Senecas and Cessna 337s, with the TCM TSIO-360 engines should be aware that the pattern for those engines is precisely the "reverse" of that shown in figure 1. These engines also have a runner log-branch induction system, but the air starts at the front and moves to the rear causing the pattern to reverse itself.
Based upon our experience at General Aviation Modifications, Inc. (GAMI), which includes balancing the fuel/air ratios in well over 2000 engines in the last year, if a standard TCM engine, with standard TCM nozzles, does not exhibit a closely similar pattern to that found in the top half of figure 1, there is almost always something abnormal (or worse) affecting the engine. These types of problems may be in the fuel metering system, may involve a leak in the induction system, or there may be a serious compression or valve problem.
Some careful observers of some specific airframe-engine combinations have noted some variation from the pattern described in the top half of figure 1 for a portion of the aircraft with which they are intimately familiar. While we are learning more about these engines, every day, so far, in our experience, the few specific engines that do not follow this pattern, which have been made available for our investigation, all end up displaying various anomalies, such as a leak in an induction coupling, or an unintended variation in the distribution of the induction air due to manufacturing variations in some of the induction system components.
Thus, one very good reason to obtain and install one of the available digital EGT/CHT engine monitors from GEM, JPI, E.I., and possibly other manufacturers, is that those instruments, used to generate the simple data matrix described in the last issue, can help the pilot and the knowledgeable mechanic identify and quickly resolve engine problems that would otherwise be very difficult to diagnose.
The bottom half of figure 1 depicts the pattern that should be exhibited by a big bore TCM engine's EGT curves, after the fuel/air ratios have been balanced.
Lycoming engines do not follow the pattern shown in the top graph of figure 1. However, Lycoming engines have their own special set of problems in achieving balanced fuel/air ratios. A new STC corrects the Lycoming cylinder-to-cylinder fue/air imbalances in a similar manner to the TCM engines.
One thing to keep in mind, if you have read and understood this series of articles, you may need to spend some time bringing your mechanic "up to speed" on some of these issues, as they often have not had an opportunity to study this information, and they, like the vast majority of pilots, have a tendency to operate on the prevailing series of old wive's tales dealing with the subject of leaning piston aircraft engines.
Let's go fly and lean a couple of engines!
For this exercise, let us assume that we have a digital engine monitor for each engine. Let us also assume that the left engine has a perfectly matched set of standard factory nozzles, but that the right engine has had the fuel/air ratios nicely balanced by adjusting the cylinder to cylinder fuel flows with a precisely calibrated set of fuel injectors. Here we go:
Possibly the single most common misunderstanding among pilots that we observe is the false notion that the cylinder with the "hottest" EGT is, of necessity, the leanest running cylinder. As the upper graph in figure 1 demonstrates, the hottest cylinder (at peak EGT) may be one of the richer cylinders, that peaks very late in the lean cycle. This happens because the measurement of EGTs in absolute terms is very difficult, due to probe placement issues and cylinder to cylinder exchanges of exhaust gases through the exhaust manifold system. Another factor which contributes to this misunderstanding by pilots is the fact that they often just look at "snapshots" of temperatures on the face of their engine monitors, rather than noting the variation in temperatures as the engine mixture is manipulated from the rich side to the lean side of peak.
We have leveled off in cruise. Today, we set up manifold pressure and RPM for about 75% power in our normally aspirated TCM powered Baron. The autopilot is "on" and we are ready to lean the engines for a long flight. Our previous practice has been to set the engine monitors to their "lean find" mode. In that mode, the typical instrument will, as we lean, alert us to the first cylinder on each engine to reach its individual peak exhaust gas temperature, by flashing the column of orange bars. This will not, typically, be the cylinder with the hottest EGT, but, rather the leanest cylinder.
As we lean the left engine from a climb fuel flow back to 14.6 gph, the orange bars in the number one column of our L/H engine monitor will begin to flash. This result is depicted by the yellow curve in the upper graph of figure 1. All of this simply means that we have reached peak EGT on the leanest cylinder on the left engine.
We do the same on the right engine (bottom graph, figure 1) but discover that on that engine, as the third column of orange bars begins to blink, the fuel flow is only 13.6 gph. Thus, on the R/H engine, with the fuel/air ratios nicely balanced, the #3 cylinder is the first to peak, and therefore the leanest cylinder.
The traditional way to finish setting the mixture for cruise operations is now to begin to enrich the mixture until the EGT drops by about two bars (50 F) for the L/H # 1 cylinder and the R/H # 3 cylinder, respectively. (Others may elect to use 75 or even 100 F rich of peak EGT for cruise operations.)
As we do this, we note that we finish leaning with a cruise fuel flow of approximately 16.4 gph on the left engine and 15.4 gph on the right engine (at the blue vertical bar, on the left side of both the top and bottom graphs.) Both engines will be producing exactly the same horsepower, but the R/H engine will be burning about one gph less fuel than the L/H engine.
As a matter of fact, if the L/H engine had a typical set of factory nozzles, which were not closely matched, then the fuel burn on the L/H engine would be still higher and the difference in fuel flows would typically be closer to 1.5 gph, rather than 1.0 gph.
At these fuel flows, we would normally continue our flight until it is time to change altitudes or land. If, as we fly along, we collect the data to fill out the forms depicted in Part II of this series, we would confirm that the fuel/air ratios on the R/H engine all nicely peak at approximately the same fuel flow, while the L/H engine has a spread of about 1.3 gph from the time the first cylinder reached peak EGT until the last cylinder reached its peak EGT.
Understand, there are no "smoke and mirrors." The fuel savings are real. Inspection of the graph shows that in the lower graph, at cruise, all of the cylinders are running approximately 50 to 60 F rich of their respective peak EGTs. On the other hand, in the upper graph, look at cylinder number six. At cruise, in the upper graph, cylinder six is running very rich, at an EGT of about 1365F, which is about 110 F richer than its peak EGT which would occur at about 1475F.
The fuel savings comes from avoiding the waste of fuel that takes place in the upper graph, when cylinders # 5 and # 6 are running very rich compared to all of the other cylinders. Some additional fuel is saved by adjusting the fuel flow on cylinders # 3 and # 4 so that they also peak along with cylinders # 1 and # 2.
But what about running lean of peak?
On the return trip, we lean the two engines to peak EGT, as before, but decide to continue leaning to try to run the engines on the lean side of peak.
Beech specifically authorizes operation on the lean side of peak with the IO-550. In fact, at high power settings, Beech requires that the engine be operated no closer to peak than 36F (20C) on either the lean OR the rich side of peak EGT.
At cruise, after each engine reaches peak EGT, we just continue to lean in an effort to run the engines on the lean side of peak. If the pilot continues to lean until the L/H leanest cylinder is 50 F lean of peak the fuel flow will be about 13.4 gph. (Yellow curve, top graph, blue bar on the right side.) Great?
Well, maybe not so great. The first thing we will notice is that the left engine will most likely be running rough. The engine will run rough because there are significant variations in the cylinder to cylinder fuel/air ratios which, on the lean side of peak, cause 5-10% variations in cylinder to cylinder horsepower output.
More importantly, notice at the 13.4 gph fuel flow, the # 6 and the # 5 EGTs on the left engine (top graph) are exactly at peak EGT. That is not a good place to be running any cylinder at high power settings. By contrast, if the pilot sets up the R/H engine the same way (lower graph) then he will get the results in the bottom half of figure 1. In that case, when leaned to 50F lean of peak EGT, all of the individual cylinders are running well away from peak EGT. That's good. The fuel consumption is also down to 12.4 gph. That's good too.
What about the cylinder head temperatures?
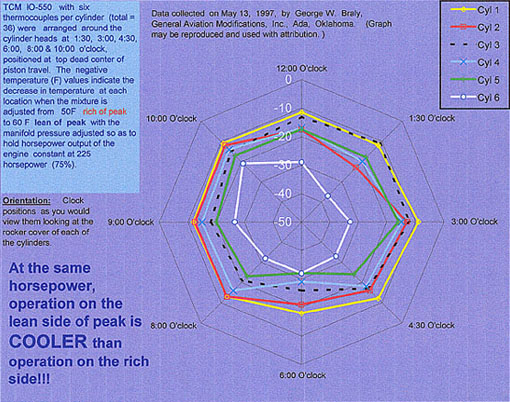
Fig. 2
This is a graph depicting the reduction in cylinder head temperatures as a result of running an engine on the lean side of peak.
The data in figure 2 was taken as part of an ongoing research program at General Aviation Modifications, Inc. For this research, a turbonormalized IO-550 was instrumented with six CHT probes arranged around the circumference of each of the six cylinder heads. This data was then fed into a computerized data acquisition system. The original purpose of the data collection was to aid in designing significantly improved baffling for these engines.
One object of the research was to make sure that any baffle change did not create an unintended "hot spot" somewhere around the circumference of the cylinder. As a by-product of that research effort, the data displayed in figure 2 was collected. That data shows that for each cylinder, indeed, for each position around each cylinder, the cylinder head temperature is decreased when the engine mixture is adjusted from about 50F rich of peak to about 60F lean of peak. Notice, that as the engine was leaned, the manifold pressure was adjusted (in accordance with the WAD recommended leaning procedure described in Part I) in order to maintain the engine's horsepower at a constant 225 horsepower.
To the best of the author's knowledge, this is the first time that this type of data has ever been published for any GA aircraft engine. In short, at a constant horsepower output, the engine in your airplane will run cooler on the lean side of peak than it does on the rich side of peak.
Summary
There are three primary points to this third installment:
- If you try to run the engine on the lean side of peak without first balancing the fuel/air ratios you run the risk of cooking one or two jugs because they will end up running rich enough to be operating continuously back up at peak EGT. At high power settings, this is not a good place for the cylinders to be operated.
- If you do balance the fuel/air ratios, you will find that engines operated on the lean side will run smoothly and in addition, they will run significantly cooler than engines operated on the rich side of peak.
- You can save significant amounts of fuel by balancing the fuel/air ratios and continuing to run the engines on the lean side of peak. The engines will run smoother and the EGTs and CHTs will be more uniform.